OBDII data for HVB

Ford Focus Electric Forum

Help Support Ford Focus Electric Forum:

This site may earn a commission from merchant affiliate links, including eBay, Amazon, and others.
michael said:
I will try to re-test for you, but can't do it til next week.
Thank you. Now FORScan can display additional decimal places. In the case of the voltage variation, the car reports 3 decimal places. This provides additional clarity to the situation. I'd be curious to see what you see.

I've only really paid attention to the variation at rest with various levels of SOC. I haven't tried much with WOT because I don't really have many spots where I could accelerate that quickly or drive that fast. I'll have to try to do that.
 
This is interesting. Go back to your post of April 7 where you have a screenshot. You show

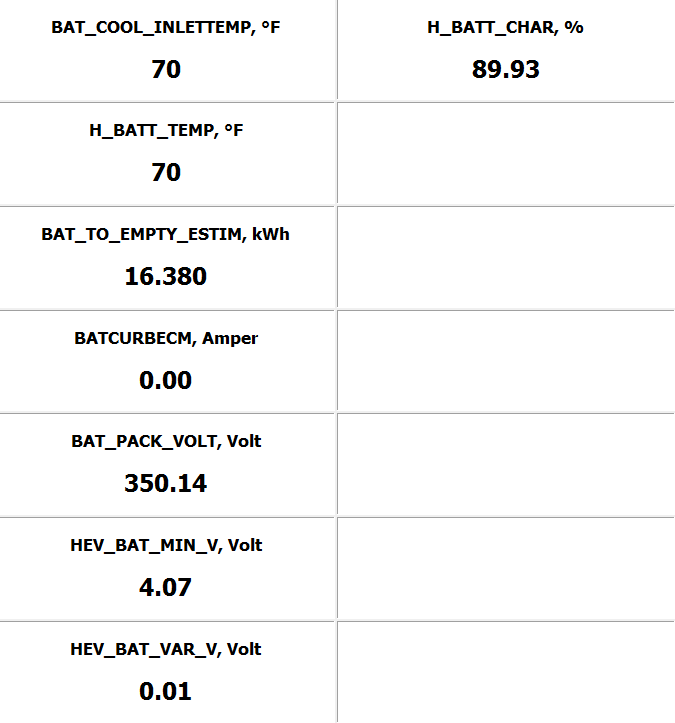
Pack Voltage 325.77
Lowest Volt 3.78
Variance 0.01


If you divide 325.77 by 86, it gives the average cell voltage, 3.788, call it 3.79. So at that point you had very consistent readings, all very close to the average. So things were looking good.

This was taken at 40% battery. If you will do this again now, nearer exhaustion and under heavy load, you will see whether the whole pack is getting tired or if one-or-more cells are sick.
 
michael said:
If you divide 325.77 by 86, it gives the average cell voltage, 378.88, call it 378.9 So at that point you had very consistent readings, all very close to the average. So things were looking good.
I'm not quite sure I follow this calculation...
 
I sent the log from FORScan to my computer by e-mail after arriving home the other day with 0.00 kWh showing for the ETE. This particular day, my wife did most of the driving, not using remote start & running lots of heat. The kWh used for the entire day according to the trip meter was 17.6 kWh. The ETE started out at around 18.8 kWh with a full charge.

I was able to calculate the kWh consumed based on volts & amps over the course of my drive. FORScan reports the mS since start of the data. Thus I could use that number of milliseconds to turn the kW into kWh. The trip home started with an ETE of 1.500 kWh. The entire drive home shows 1.304 kWh used based on my calculated data. MFM shows 1.2 kWh used. After the ETE hit 0.00 I used another 0.070 kWh out of the HVB based on my calculations.

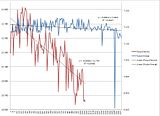
The HVB average module temp was 54 F for this trip. The minimum module temp was 48 F & the maximum module temp was 57 F. The outside temp was about 28 F. The voltage variation was about 12 mV when I first began driving. It increased to 102-105 mV by the end of the trip. Below is a graph of the ETE & voltage variation. You can click on the image to make it larger.


Here are various measurements of ETE compared to calculated values, these are presented in order from end of trip working back toward the beginning, I tried to keep it to segments that were either only discharging or only recharging via regen
  • ETE from 0.100 to 0.000 (0.100) - calc 0.094 kWh
  • ETE from 0.058 to 0.102 (0.046 increase via regen braking) - calc 0.054
  • ETE from 0.158 to 0.058 (0.100) - calc 0.083
  • ETE from 0.150 to 0.100 (0.050) - calc 0.044
  • ETE from 0.300 to 0.200 (0.100) - calc 0.041
  • ETE from 0.304 to 0.310 (0.006 increase via regen) - calc 0.018
  • ETE from 0.375 to 0.325 (0.050) - calc 0.043
  • ETE from 0.465 to 0.375 (0.090) - calc 0.072
  • ETE from 0.978 to 0.458 (0.520) - calc 0.425
  • ETE from 1.082 to 0.990 (0.092) - calc 0.072
  • ETE from 1.386 to 1.060 (0.326) - calc 0.318
  • ETE from 1.486 to 1.384 (0.102) - calc 0.145
  • ETE from 1.500 to 1.480 (0.020) - calc 0.052
The total ETE change in the above segments (not including the two regen segments) is 1.550 kWh. The total calculated kWh used is 1.389 kWh. So the ETE definitely declines faster than the car actually uses power out of the HVB at this low SOC level.

I will try to take more measurements for trips at other levels of SOC for comparison.

Edit: here is some additional info. The pack voltage at the beginning of this trip was 308. It was 290 at the end. The voltage at a full charge is around 350 volts. The minimum cell voltage was 3.33 at the end, compared to 3.57 at the beginning. The minimum cell voltage is about 4.03 V at a full charge. The abs SOC dropped from 15.78% to 7.8%. The displayed SOC went from 9.0% to 0.0%.
 
michael said:
I'm Oops. Sorry. Typo. Average 3.79. Does this clarify?? I have fixed above post
The numbers make sense, but I'm not sure how it will tell me if there is a sick cell or just a older pack. The voltage variation of our pack now at rest is relatively low & it seems to increase almost linearly as the HVB SOC decreases.
 
hybridbear said:
I sent the log from FORScan to my computer by e-mail after arriving home the other day with 0.00 kWh showing for the ETE. This particular day, my wife did most of the driving, not using remote start & running lots of heat. The kWh used for the entire day according to the trip meter was 17.6 kWh. The ETE started out at around 18.8 kWh with a full charge.

......

I was able to calculate the kWh consumed based on volts & amps over the course of my drive. FORScan reports the mS since start of the data. Thus I could use that number of milliseconds to turn the kW into kWh. The trip home started with an ETE of 1.500 kWh. The entire drive home shows 1.304 kWh used based on my calculated data. MFM shows 1.2 kWh used. After the ETE hit 0.00 I used another 0.070 kWh out of the HVB based on my calculations.

The HVB average module temp was 54 F for this trip. The minimum module temp was 48 F & the maximum module temp was 57 F. The outside temp was about 28 F. The voltage variation was about 12 mV when I first began driving. It increased to 102-105 mV by the end of the trip. Below is a graph of the ETE & voltage variation. You can click on the image to make it larger.
Edit: here is some additional info. The pack voltage at the beginning of this trip was 308. It was 290 at the end. The voltage at a full charge is around 350 volts. The minimum cell voltage was 3.33 at the end, compared to 3.57 at the beginning. The minimum cell voltage is about 4.03 V at a full charge. The abs SOC dropped from 15.78% to 7.8%. The displayed SOC went from 9.0% to 0.0%.

Based on the above, I would say your battery is healthy. at 19K miles, you have 17.6 kWh usable, even with very low temperatures. I would be VERY happy if my battery had that kind of capacity left.

The fact that you showed 18.8 ETE when charged vs 17.6 actually usable is completely consistent with my experience. That is one of the reasons I feel the ETE is not dependable. The dash battery percentage seems to be calculated based on the questionable ETE values and thus also not dependable.

Your biggest problem seems to be that the ETE estimate is particularly inaccurate near exhaustion. I agree that's a problem, but better to have that problem than to have the much greater degree of battery fade that I am observing.


Your chart also supports this. Even with 1.5 kWh reported ETE your cells are balanced to about 10mV. Only in the end stages of discharge do they diverge as the weakest cell falls before the others. I think we have to chalk this up as an example of where the fuel gauging software isn't totally accurate. In reality, battery fuel gauging isn't an easy task, particularly as the cells diverge in capacity.

To give you some comparison, my battery is now fully charged, shows 17.1 ETE and temperature 64 F. I expect the usable energy (per trip gauge) to be in the low 15's
 
michael said:
Based on the above, I would say your battery is healthy. at 19K miles, you have 17.6 kWh usable, even with very low temperatures. I would be VERY happy if my battery had that kind of capacity left.
Thanks. I'll try to be more optimistic. I'll try to record more data in the coming weeks to see how the ETE drop compares when the SOC is higher.
 
Yesterday's drive gave 15.4 kWh useful with a battery temp in the mid 60's. When I arrived home, the trip meter showed 12.1 and the ETE 3.3. 12.1 + 3.3 = 15.4, that's how I estimated it.

As noted above, the ETE showed 17.1 at the start of the trip.
 
The FFE thermal management to heat the HVB seems to be pretty poor. I was able to use FORScan all summer & not once did the car need to cool the HVB other than while charging. The cooling seemed to be very effective. The HVB temp would cool quickly & the coolant temps shown in FORScan would be cooler than ambient air going into the HVB to cool it (70s for coolant temp with outside temp in the 80s).

Now that winter has set in, the HVB gets colder than 50 F every day. It usually starts out around 74-79 F in the morning, after charging overnight. Even on days where we're driving the car throughout the day & keeping the cabin warm, the HVB quickly drops down to about 45-48 F. The temp then seems to stabilize there while driving as the car tries to keep the HVB warm. The HVB temp will drop, even while we're driving & the HVB is being discharged. When the car sits parked outside for hours the HVB temp can drop into the 30s.

The car doesn't seem to really do anything to heat the HVB, it only stops the temperature from falling farther than the current HVB temp. The car doesn't seem to really bother heating the coolant for the HVB. The cabin heater coolant loop may contain coolant that's 140-165 F from remote starting the car for cabin heat, but the battery coolant loop will only contain coolant that's 1-2 F warmer than the HVB temp. I don't understand why the car wouldn't be programmed to use the warm heater core coolant to heat the HVB more effectively. It seems very wasteful to let the battery coolant pump run for a longer period of time with cold coolant versus running for a shorter period of time with hot coolant from the heater core loop. The coolant in the heater core loop cools down naturally as we drive (since we almost always drive with the HVAC off & just use remote starting to get heat for better efficiency) and I'd think that a better use of the energy stored as heat in that coolant would be to use it for heating the HVB, rather than letting it go wasted into the atmosphere.
 
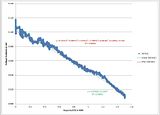
Today I updated my chart of HVB ETE & SOC over time. The Focus seems to have a pretty linear rate of capacity loss. Based on the ETE estimate normalized to 100% SOC, I'm down about 1 kWh of capacity over the 7 months that I've been tracking data (late May through now).
 
Have you taken into account the weather?

Looking at your chart it appears to peak in late July/August--e.g. matching the weather. Thus your capacity loss over time may be due to weather and ambient temps. Of course you'd need to track that for at least a year to see.
 
jmueller065 said:
Have you taken into account the weather?

Looking at your chart it appears to peak in late July/August--e.g. matching the weather. Thus your capacity loss over time may be due to weather and ambient temps. Of course you'd need to track that for at least a year to see.
Since we park overnight & charge in a heated garage, there is no real change in HVB temps when fully charged over the course of time. Our HVB temp at a full charge is almost always between 74 & 82 F. I will continue to monitor throughout the winter & into next spring. We'll see if things change once the weather warms up. In the summer the HVB temp would be fairly stable throughout the day and the cooling system would need to be active while charging to keep the temperature down. In the winter the HVB temp falls from being in the 70s in the morning to being in the 30s or 40s when the car comes home in the evening. The car immediately charges for a short period to heat the HVB up to 50 F. I need to do additional monitoring when it is at home waiting to charge to see what it does during this time. The Focus still does completely disconnect from the EVSE, as the "charging" light turns off on our HCS-40. Our Fusion Energi constantly runs the fan which circulates air from the trunk across the HVB to warm it up when it is plugged in waiting to charge right now. Its HVB temps are also consistently lower than the Focus after charging. The Fusion HVB will also warm 5+ degrees from remote starting, as the ~6000 watt draw is a much bigger load on the smaller HVB. Remote starting seems to have only minimal (imperceptible) impact to warm the HVB of the Focus Electric.
 
I presume you are looking at ETE as reported over OBD? I gather you are dividing the reported ETE by 0.82 (or some similar number?) to relate this to full battery capacity?

As noted earlier, I do not trust this ETE value. I have no way of knowing how they make the estimate but I do see a substantial discrepancy between the reported ETE and the amount that can be usefully drawn (by trip meter)

That said, I do believe you may be seeing an actual reduction in capacity, as I have, but I wouldn't use the reported ETE as the basis for estimate. I'd go by the trip meter. I believe the reduction you are seeing is related to battery fade, but I wouldn't trust the specific numbers though it doesn't look too far off. 5% reduction over 7 months is about what I expect.

In my case, reported ETE is in the low 17's (varies day to day) and useful is in the mid to low 15's (also varies)
 
michael said:
I presume you are looking at ETE as reported over OBD?

As noted earlier, I do not trust this value. I have no way of knowing how they make the estimate but I do see a substantial discrepancy between the reported ETE and the amount that can be usefully drawn (by trip meter)

That said, I do believe you may be seeing an actual reduction in capacity, as I have, but I wouldn't use the reported ETE as the basis for estimate. I believe the reduction you are seeing is to some extent related to battery fade, but I wouldn't trust the specific numbers.

In my case, reported ETE is in the low 17's (varies day to day) and useful is in the mid to low 15's (also varies)
ETE is estimated based on voltage. I am considering beginning to also monitor pack voltage at a full charge to see how that varies. I agree that it's not reliable for determining how much energy you can take out of the HVB, but it should be a consistent measurement.
 
How do you make the calculation?

I would hope the fully charged voltage is constant throughout the battery life, although I suppose the designers would have had the option of raising the Voltage as the battery fades to recover some lost capacity.
 
michael said:
How do you make the calculation?

I would hope the fully charged voltage is constant throughout the battery life, although I suppose the designers would have had the option of raising the Voltage as the battery fades to recover some lost capacity.
The car estimates ETE based on voltage according to the workshop manual I have on CD. Unfortunately I don't have a CD drive at the present time to be able to open it & copy & paste the precise text. But that's what I remember reading. Shouldn't pack voltage decrease as the capacity decreases? That's what I thought I had learned.
 
No. The normal charging process takes the cells to some predetermined Voltage, typically about 4.1 (varies based on the design of the pack).

In the case of most lithium batteries, 4.2 V/cell is 100% SOC, so conservative designs target some lower value. As each individual cell reaches this target, a "balancing" procedure limits that cell's charging while the other catch up. I have the impression that the FFE charges to about 4.08 V/cell, although I'm not sure where I got that information.

As the battery discharges, obviously the cell Voltages (and the pack Voltage) decline. When the weakest cell reaches some predetermined minimum value, the battery is considered discharged even if there are some stronger cells that could still provide energy.

The SOC at any point in the discharge cycle is estimated from a variety of factors, the specifics of which vary with implementation. However, factors which are often used by battery fuel gauges include:

1. Measured battery Voltage
2. Battery Voltage sag under load
3. Temperature
4. Measurements of Ampere-hours ("Coulomb counting")

Battery fuel gauging (based on SOC) is not easy. I don't know the exact algorithm used in the FFE. Maybe the workshop manual describes? I'd be really interested to find this out.

But to determine the ETE (as opposed to the SOC) is even harder since the battery full capacity is constantly fading.
 
I have been collecting data about our car since May 2015. We currently have 21,600 miles. We've driven about 7600 miles since I started collecting data & have used 1800 kWh to drive per the trip meter. Our overall average ETE during that time has been 19.187 kWh. Min/Max are 18.066/19.950 kWh. The abs SOC avg/min/max are 90.00/87.83/91.88%. The HVB temp avg/min/max are 79/61/97 F.

The last time I've updated my computer spreadsheet was 12/26/15. I print out a page which I keep in the door to write down the numbers. About every 1.5-2 months I update it on the computer. I usually only drive the Focus 2-3x per week starting with a full charge. My wife takes it usually 4x per week at a full charge, so I only have data for about half of the days.

During November/December (the only winter data I have so far) the ETE avg/min/max are 18.668/18.066/19.108. The abs SOC avg/min/max are 89.33/87.83/90.93%. The HVB temp avg/min/max are 78/61/95 F.

You can see how much the ETE is dropping over time. June & July of last year reported an ETE avg/min/max of 19.506/19.006/19.950 kWh, abs SOC avg/min/max of 90.07/88.90/91.88% and HVB temp avg/min/max of 80/72/97 F. Additionally, the SOC reported by the car when fully charged is dropping over time.

You can also see that our HVB temp at a full charge is not significantly different in the winter compared to the summer, but our ETE & how high our HVB is charging have dropped significantly as we've accumulated miles.
 
Back
Top